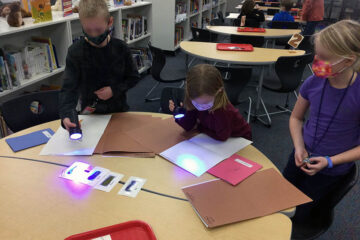
In this module, participants explore how well various fabrics help a can of hot water retain heat, learning about thermal transport. It can be a standalone project or used with another activity. This exercise is particularly effective in the autumn as winter approaches.
Age Range
All grades
Time Required
[Version 1] One hour, not including gathering time;
[Version 2] 20 minutes as part of a 60+ minute activity
Helpers
At least one to handle quickly filling the cans with boiling water
Supplies
Both Versions
- A number of identical (empty) aluminum cans. Determine the volume of the can. Narrower cans, such as those from energy drinks, work better than wider cans (e.g., soda cans). Cans/bottles with narrower mouths are better than those with wider mouths, since more heat will be lost through the (non-insulated) mouth the wider it is.
- An easily read count-up timer. One on a tablet or computer is ideal.
- Assorted “coats”, at least one for each can (see below for details)
- Boiling water (enough to fill each can plus extra)
- A funnel that fits into the opening of the cans
- A measuring cup that holds at least as much as the volume of a can
- Six small tokens per student (pennies, buttons, paper clips, bits of paper, etc.)
Version 1
- An immersible thermometer for each can. Five-inch-long stainless steel analog food thermometers – available from Amazon (or similar) in bulk for less than $2.50 each – are good choices. Long, glass thermometers can be used if they can accommodate boiling water and the mark for 90° can be seen when inserted into a can. The thermometers do not have to be identical.
- A record sheet and pencil for each can
Version 2
- At least one immersible thermometer that reaches equilibrium and can be read quickly. A five-inch-long stainless steel analog food thermometer is a good choice.
Printables
Printable record sheets for both versions of the activity and for Fahrenheit or Celsius measurements, a themed word search, and a simple introductory presentation to how clothes keep you warm (should you desire to use it) are provided can be downloaded using the button below.
Preparation
If you are, or know, an avid tailor or seamster who makes clothing then you are likely to have scraps on hand for your cans’ wardrobe. Alternatively, you can purchase narrow lengths of fabrics, one half the diameter of your cans plus 1.5 inches (~4 cm) wide. If you must purchase fabrics, we suggest a short fake fur, fleece, denim, cotton or blend jersey (T-shirt material), a nylon or polyester ”windbreaker” type fabric, and a cotton quilted fabric. Of course, you can choose anything from your available scraps, but consider focusing on fabrics that are typically used in coats, jackets, and other outerwear.
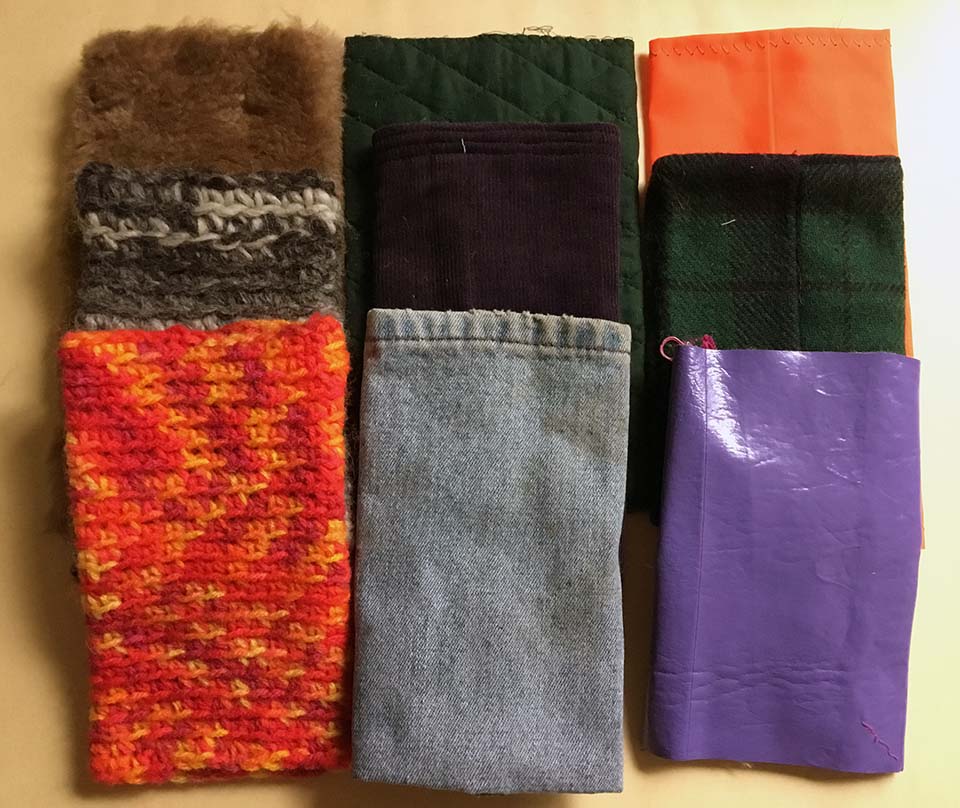
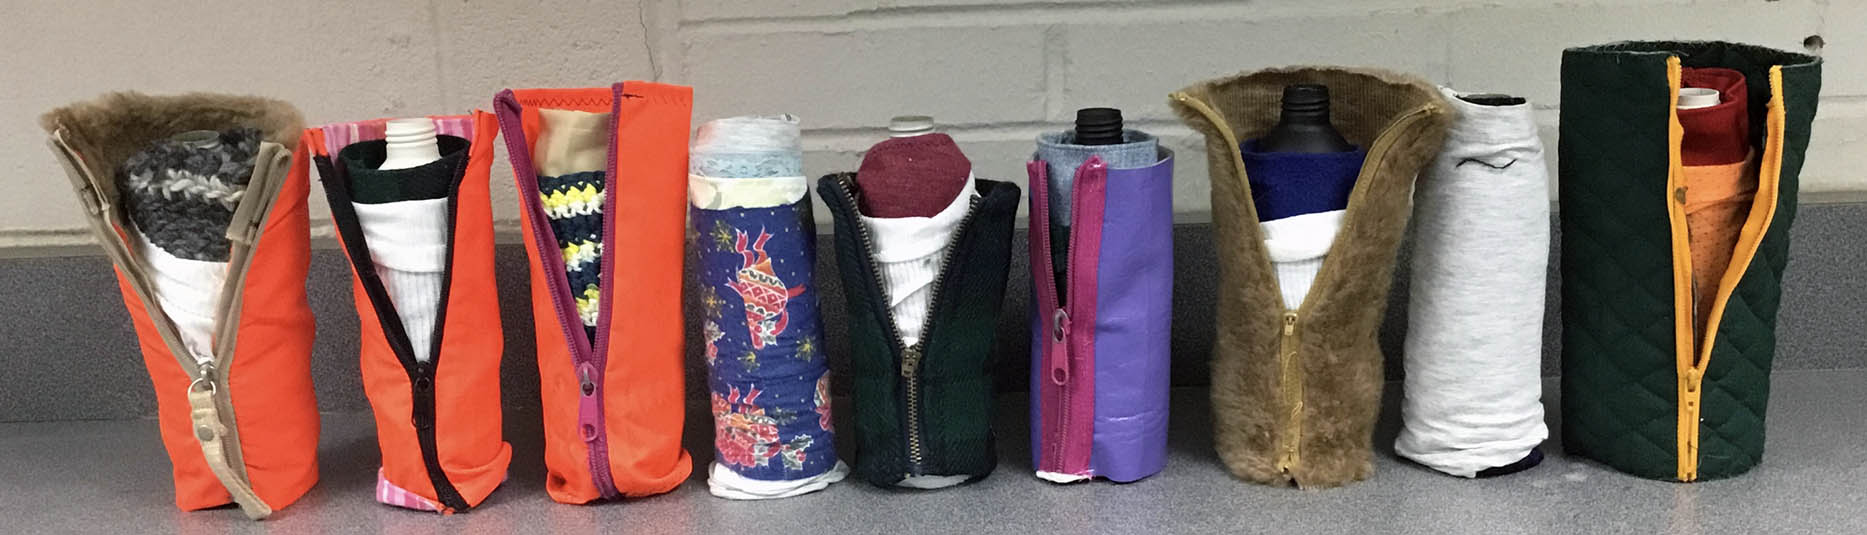
For each fabric, cut two pieces a half inch (~1.3 cm) longer than the height of your cans. Make a tube by joining the two sides using a ¼ inch (~0.6 cm) seam allowance, either by hand stitching or with a sewing machine, or even stapled (not advised). If the “coat” is too loose then increase the seam allowance slightly. Leaving the seam allowance on the outside can make it easier to slip over the can. Prepare two “coats” from the fur, one with the fur inside, and one with the fur outside. Consider making two denim “coats”, so one can be tested wet. If you knit or crochet, or know someone who does, consider knitting a “sweater(s)” for the cans from different fibers.
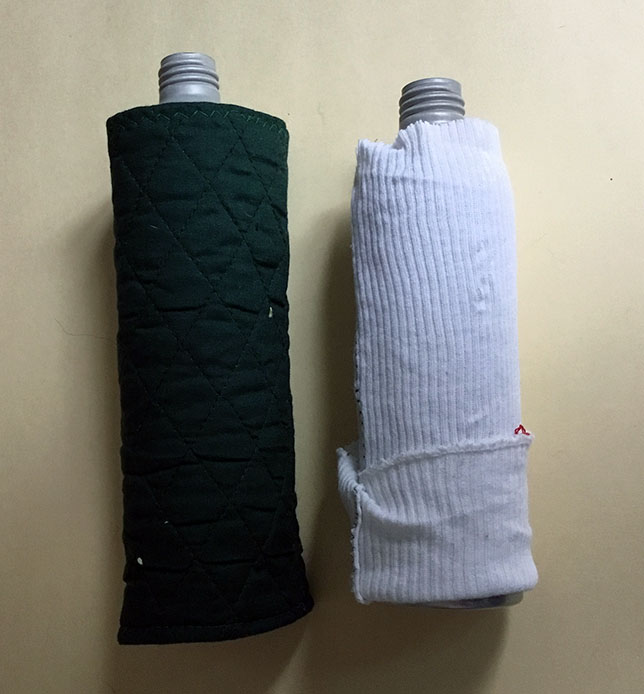
Socks can be another source of can clothing, as are sleeves and lengths of leggings cut from worn out children’s’ clothing.
Ideally, prepare several more “coats” than cans so students can choose how to dress them. If you have only one “coat” per can, dress each can before the activity.
The biggest challenge during this activity is getting very hot water into the cans as quickly and as close to the same time as possible. We used an electric kettle and some thermos bottles, which our volunteers filled with boiling water shortly before the activity. Measure the water for each can using the measuring cup, and use the funnel to prevent spilling. It is important not to get the “coats” wet unless you are deliberately comparing the insulating properties of wet fabric to dry.
Running the Module
Gathering
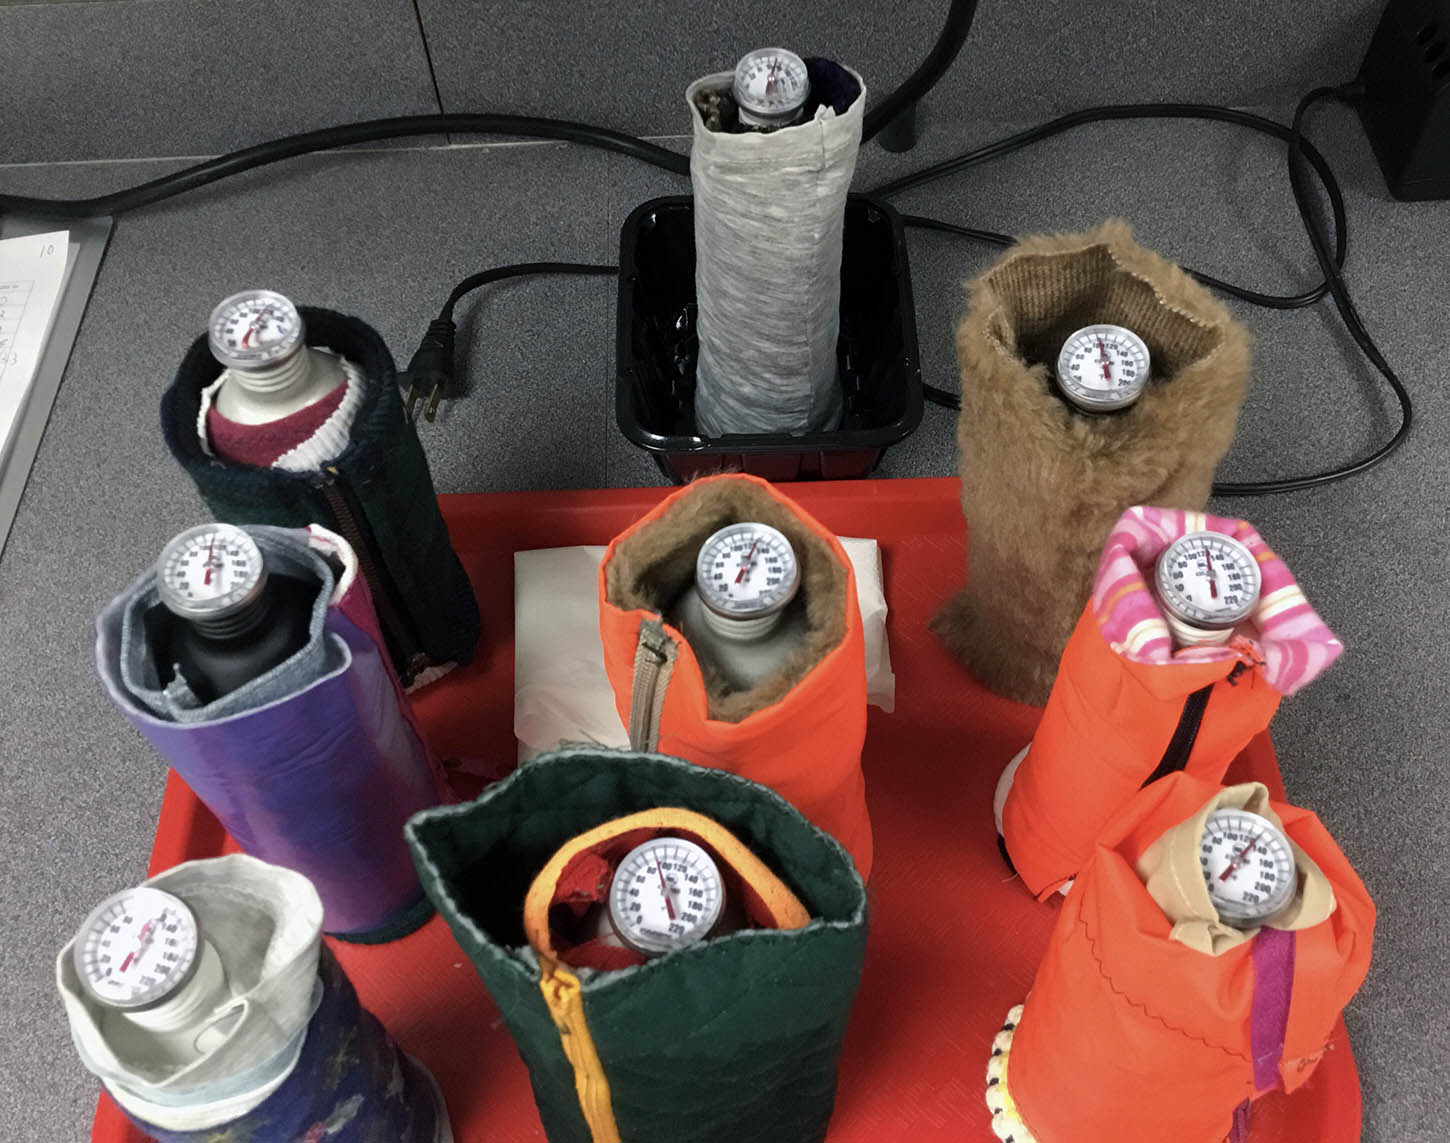
You want to give the cans as much time as possible to cool. If you have one “coat” per can begin ten minutes before the children arrive. Start the timer and add the hot water to each can. Add the thermometers, and record the temperature and time it was measured for each can. Place the cans, record sheets and pencils on tables, spaced so that groups of children can read them without bumping into one another. Place the timer where it can be seen by all. Assign students or groups of students to each can.
If you have more “coats” than cans, assign students or teams of students to each can as they arrive. Instruct them to choose “coats” and dress the cans, choosing those they think will best keep the cans warm. Give them five minutes to choose “coats” and dress the cans. Then gather the children for discussion while the volunteer(s) quickly add the hot water and take initial readings, as above.
Version 1
Introduction
Explain how to read the thermometers, then show several enlarged examples of a dial or glass thermometer’s column to test their understanding. Then send each student or team to read and record the temperature of their assigned can and the time it was measured. Regather the students. (Elapsed time ~10 minutes)
Discuss how to choose the best clothes to wear to stay warm in winter. Describe the various kinds of fibers used in clothing and the insulating properties of each. Discuss the value of layering, breathability and moisture wicking. Take about ten minutes for this discussion. Next, give each student six tokens. Instruct them to place three tokens at the can that they think will stay warmest, two tokens at the second warmest can, and one token at the third warmest can.

After voting is complete, ask the students or teams to read and record the temperature of and time it was measured of their assigned can. (Elapsed time ~20 minutes.) Ask your volunteer to tally the votes, write the totals on the record sheets, determine the first, second, and third place voted cans, and write the type of coat on each sheet.
During the next 30 minutes, provide other activities the children can do. This might include puzzles (a word search puzzle is included in the downloads), plotting the temperature of the can on a grid, examining fibers and fabrics with a magnifying glass or microscope, choosing outfits for various weather conditions, evaluating their own winter clothing, or, if you have access to an infrared thermometer, measuring the temperature of various body parts to explain why we lose heat most rapidly from our heads, wrists, feet and other places where our blood vessels are close to the surface. At 30, 40, and 50 minutes of elapsed time instruct students to read and record the temperatures of their cans. Note which can stayed the warmest, the second place can, and the third place can.
Conclusion
Compare the results with the students’ predictions. Consider explanations for discrepancies. If you compared wet to dry denim, ask the children to explain why jeans are not a good choice to wear sledding. (Water is a better conductor of heat than air. When clothes are wet, water replaces some or all of the air between the fibers. Because water is a better thermal conductor than air, this greatly increases the loss (transport) of heat from the can. Unlike cotton, wool is able to retain its insulating properties even when wet.)
The results from our 2023 run are shown below:
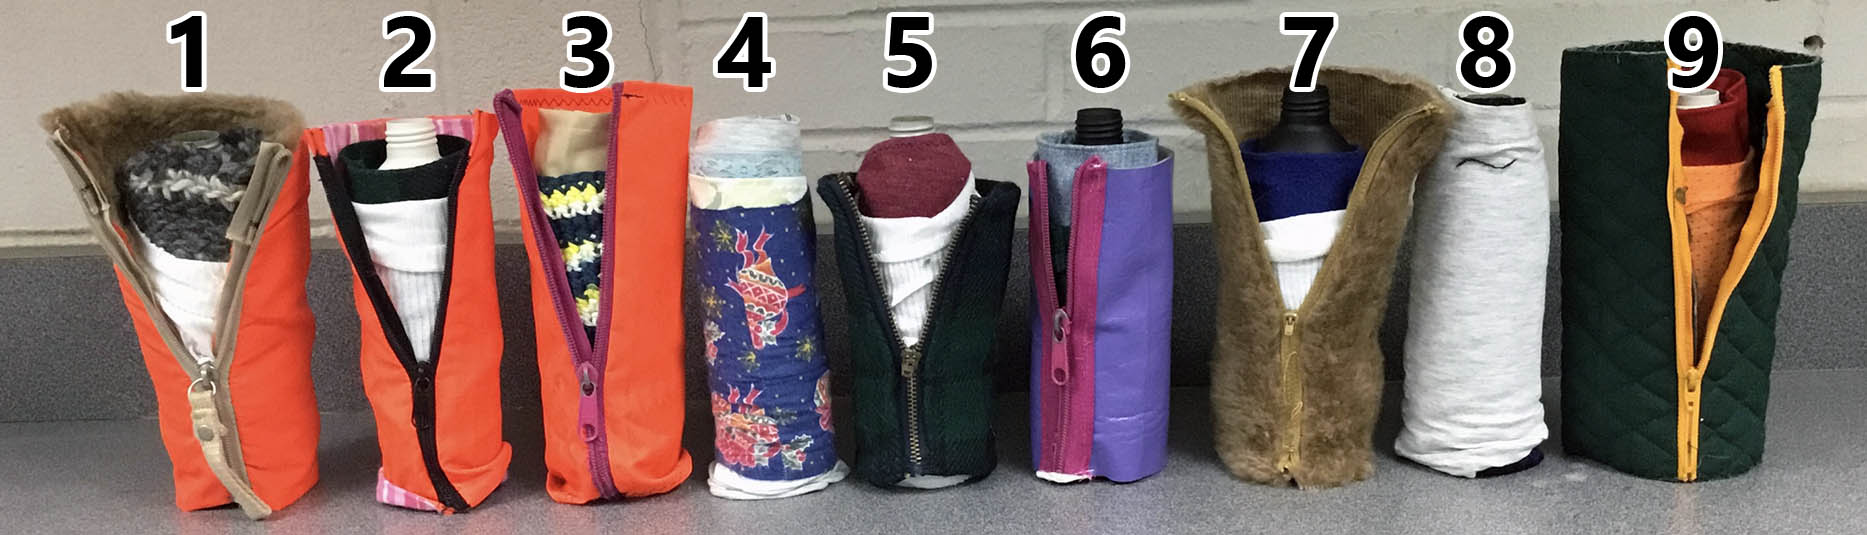
| Can # | Clothes | # of Votes |
|---|---|---|
| 1 | Cotton rib knit jersey, 100% wool sweater, fur-lined nylon windbreaker | 46 |
| 2 | Cotton rib knit jersey, wool suiting, flannel-lined nylon windbreaker | 8 |
| 3 | Acetate lining, cotton sweater, nylon windbreaker | 13 |
| 4 | Cotton jersey, cotton flannel, cotton/polyester fabric (no coat) | 3 |
| 5 | Cotton rib knit jersey, acrylic sweater knit, fleece-lined wool jacket | 20 |
| 6 | Cotton thermal weave, cotton denim, vinyl raincoat | 7 |
| 7 | Cotton rib knit jersey, polyester fleece, fur-side-out jacket | 14 |
| 8 | Cotton jersey, wool suiting (no coat) | 9 |
| 9 | Polyester sport jersey, cotton duck cloth, quilted cotton jacket | 8 |
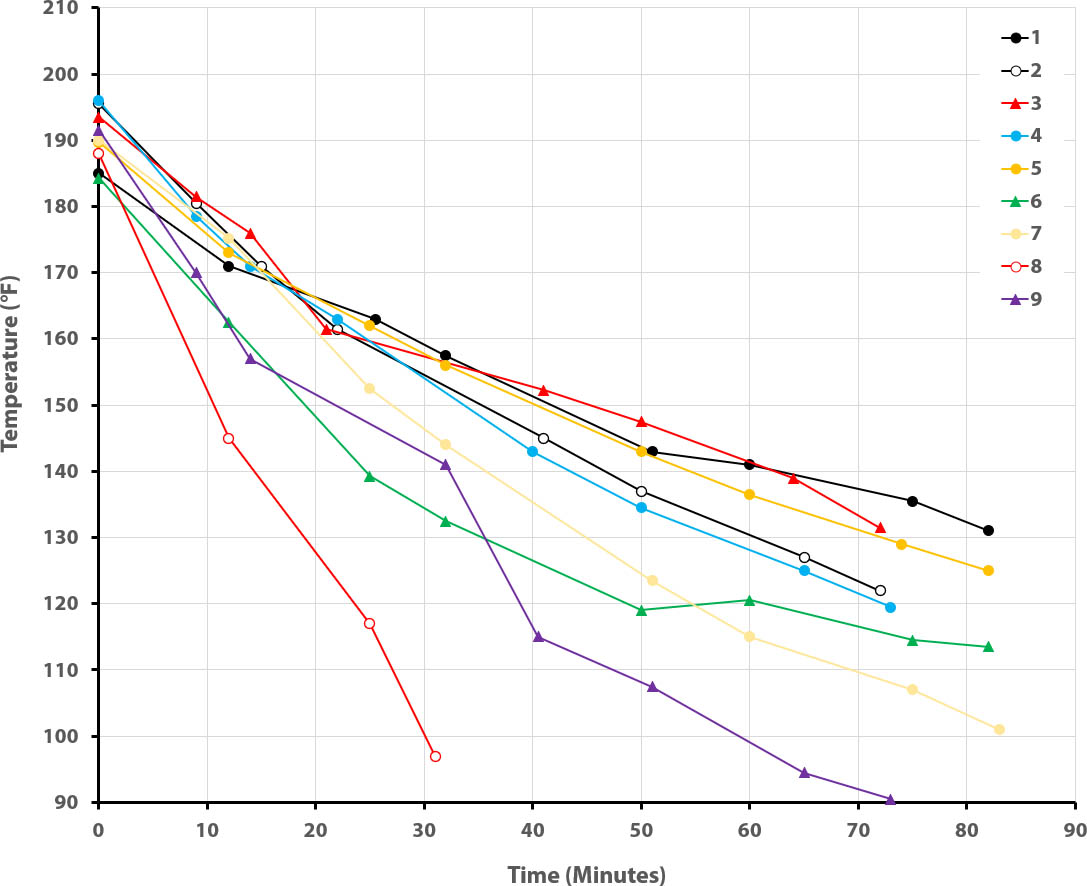
So overall the students predictions fared rather well (see Extended Data Analysis for more detail). Outfit #4 lost heat so quickly because there was a leak in the bottle that let water seep soak the fabric. Being cotton, it rapidly lost most of its insulative benefit.
Version 2
Introduction
Discuss how to choose the best clothes to wear to stay warm in winter. Describe the various kinds of fibers used in clothing and the insulating properties of each. Discuss the value of layering, breathability and moisture wicking. A sample slide show is attached. Take about ten minutes for this discussion, then give each student five tokens. Instruct them to place three tokens at the can they predict will stay warmest, two tokens at the second place can, and one token at the third place can. Ask your volunteer to tally the votes, write the totals on the record sheets, determine the first, second, and third place vote getters, and write the type of coat on each sheet.
The next 40 – 45 minutes can be spent doing the related activities described in version 1, or on some other activity, including ongoing projects from previous meetings.
Conclusion
About ten minutes before the meeting ends gather the students while the volunteer reads the temperature of each can. Note which can stayed the warmest, the second place can, and the third place can.
Compare the results with the students’ predictions. Consider explanations for discrepancies. If you compared wet to dry denim, ask the children to explain why jeans are not a good choice to wear sledding. (Water is a better conductor of heat than air. When clothes are wet, water replaces some or all of the air between the fibers. Because water is a better thermal conductor than air, this greatly increases the loss (transport) of heat from the can. Unlike cotton, wool is able to retain its insulating properties even when wet.)
Extended Data Analysis
If your students are in later middle school or high school, and will have encountered exponentials in mathematics, you can actually dig deeper into the measured temperature data and the underlying physics of heat transfer. Our students were elementary schoolers, so this would have been far beyond them, but it can be a great way to work in the topics of fitting data with models and extracting real, quantitative physical information.
The heat loss involved in this activity can be modeled by what is known as Newton’s Law of Cooling, which states that “the rate of heat loss of a body is directly proportional to the difference in temperature between the body and its environment.” The body, in this activity is the can of water, and the environment is the temperature of the air in the room. Because the can is cooling over time, the temperature difference – and thus the rate of heat transfer – between the water and the room will also decrease over time. The actual process of deriving this equation is beyond the scope of the students’ mathematics (and thus this activity), but the important part is that it gives you the following simple equation for how the can’s temperature (T) will change over time (t):
T = TR + (T0 – TR)e–rt
where TR is the temperature of the room, T0 is the initial temperature of the water, and r is the coefficient of heat transfer. Each material (coat) will have its own value of r, which will be a constant. The higher r is, the more easily heat is transferred and thus the faster the water will cool. This means that if we can solve for each outfit’s r from the temperature measurements, we can quantitatively compare the effectiveness of each outfit!
Don’t worry, there is no need to do this by hand! If you have access to a program like Microsoft Excel, it can fit the data for you! There are myriad excellent tutorials for how to fit data in Excel (and similar programs) available online, so I won’t go too far into fiddly detail, but here is the procedure:
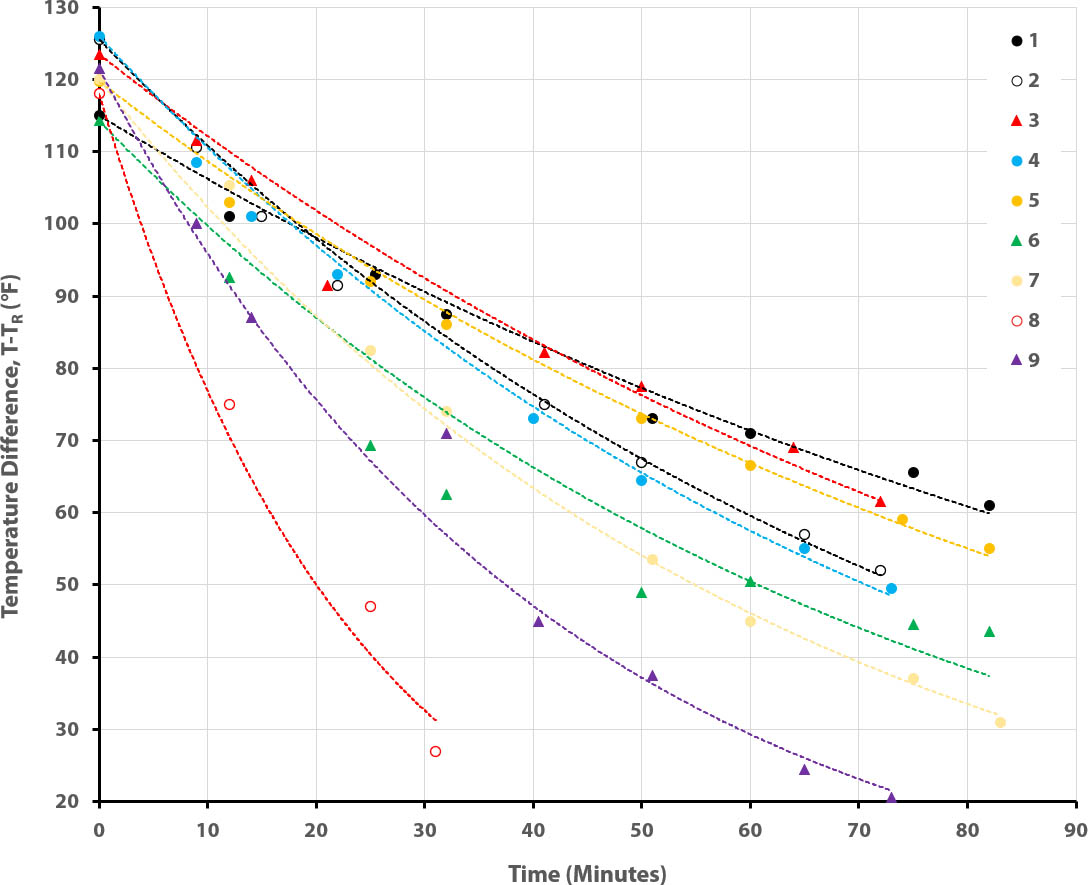
In Excel, you will want to actually plot the temperature difference (T–TR) versus time (t). Make two columns of data: the time of the measurement (t, on the x-axis) and the measured temperature difference (y-axis). Make a scatter plot from the data and, selecting each coat’s data in turn, choose “Add trendline” and select “Exponential”. The last thing you have to do is to tick the “Set Intercept” box and enter the value of (T–TR) you measured at the start of the experiment (t=0). Voila! Excel will draw the best fit exponential curve to your data. If you tick the “Display Equation on chart” box, it will then put the equation for that curve on the plot, allowing you to see what that outfit’s value of r is.
Here is what that looks like for our 2023 measurements (from above):
| Can # | Heat transfer coefficient (r) | Rank |
|---|---|---|
| 1 | 0.00796 | 1st |
| 2 | 0.0124 | 4th |
| 3 | 0.00965 | 2nd |
| 4 | 0.0131 | 5th |
| 5 | 0.00972 | 3rd |
| 6 | 0.0136 | 6th |
| 7 | 0.0159 | 7th |
| 8 | 0.0429 | 9th |
| 9 | 0.0237 | 8th |
If you’re like us, you were shocked at how well the model fit the data, considering the measurements were taken by young elementary schoolers! It certainly validates the experiment. The students predicted the top three outfits would be #1, #5, and then #7 (with #3 close behind). Not bad at all! They correctly predicted #1 would be best, and that #3 and #5 would perform very well. #7 threw them for a bit of a loop, probably due to the association of fur being warm. As noted earlier, #4 had sprung a leak, explaining why it fared so terribly; don’t get cotton wet if you want to stay warm!
One other thing that stood out in the analysis was #6. You can see visually that the curve doesn’t actually fit the data nearly as well as the others. The water temperature dropped more quickly than expected. We’re not sure why, right now. It might have also been leaking, but more slowly than #4.
Beyond Fabric?
This activity could be expanded by testing other forms of insulation, like expanded polystyrene foam (e.g., “Styrofoam”), to compare with the fabrics.
What kinds of outfits did you and your students create? Any fabrics that worked surprisingly well? Let us know in the comments!
0 Comments