Kidizen Science

  • Home
  • Browse Posts

Accuracy and Precision Plots

Published by TheAdmin on November 3, 2020November 3, 2020

Plot showing a narrow spread of values, but they are far from the actual value. Precise but not accurate.
Plot showing a broad spread of values, around the actual value. Accurate but not precise.
Plot showing a narrow spread of values around the actual value. Precise and accurate.
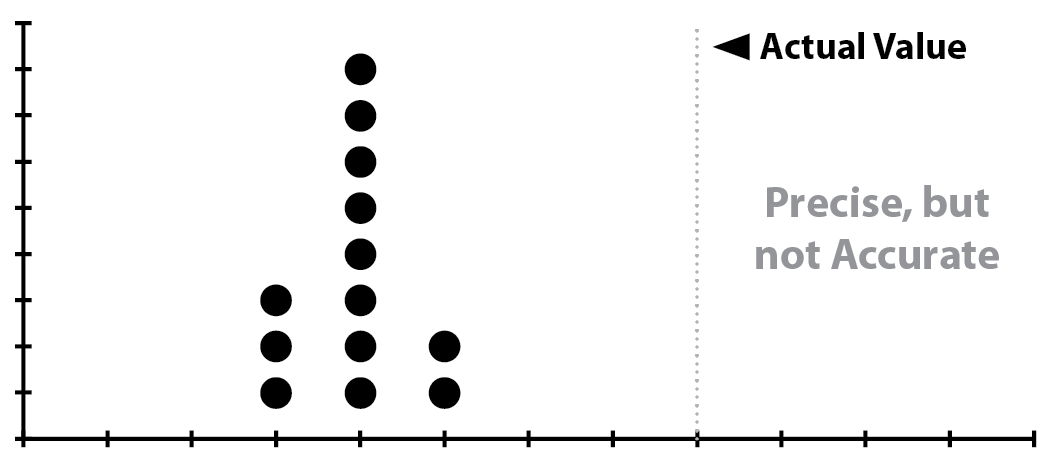
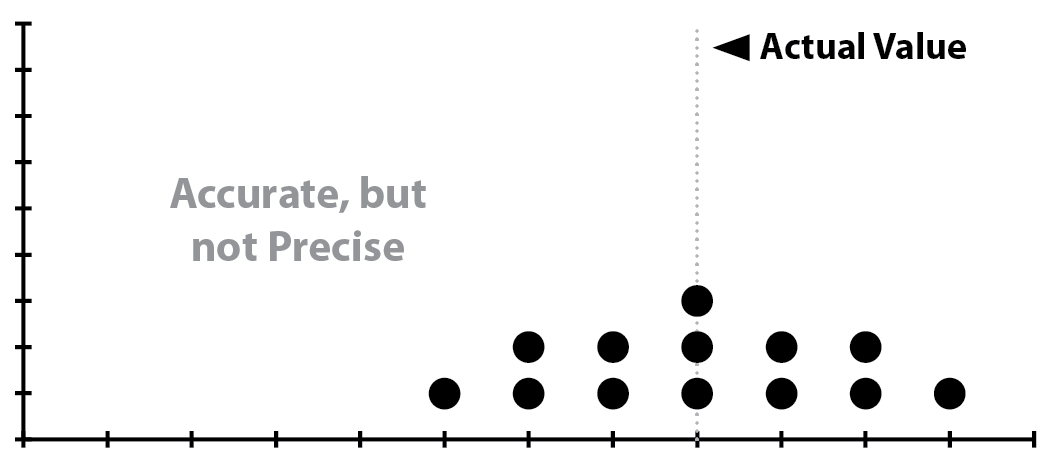
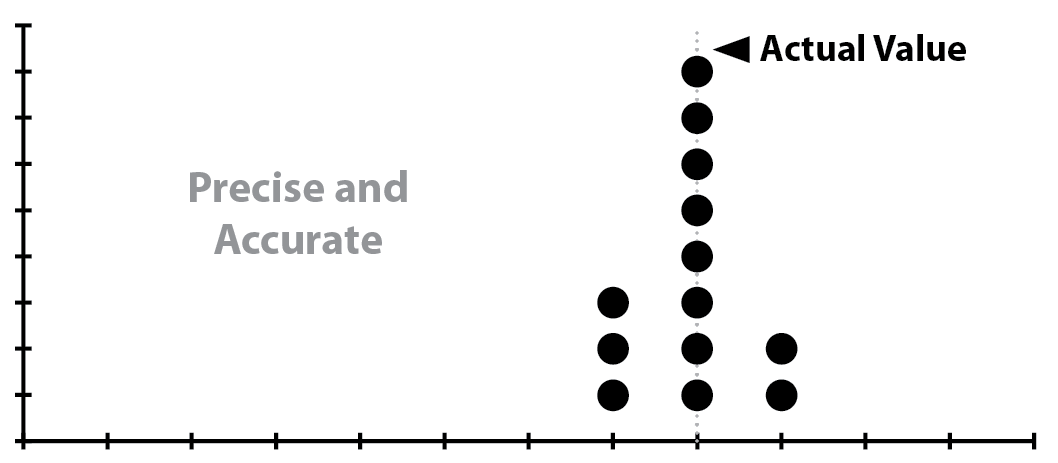
Simple examples of the difference between accuracy and precision in histograms.
Categories:

Recent Posts
  • Keep the Heat
  • Map and Compass Scavenger Hunt
  • Whodunit — Cracking the Case with Science
Categories
  • Logistics
  • Modules
  • Toolbox

Related Posts

Modules

Keep the Heat

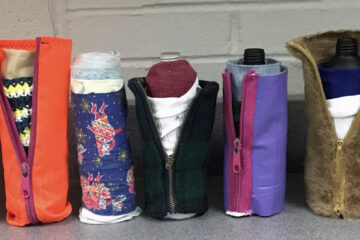
In this module, participants explore how well various fabrics help a can of hot water retain heat, learning about thermal transport.

Modules

Map and Compass Scavenger Hunt

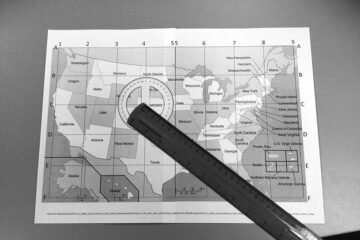
This economical and easy-to-prepare activity combines learning to use a map and compass in a scavenger hunt format. It can be a standalone indoor activity, or an introduction to the fundamentals of orienteering.

Modules

Whodunit — Cracking the Case with Science

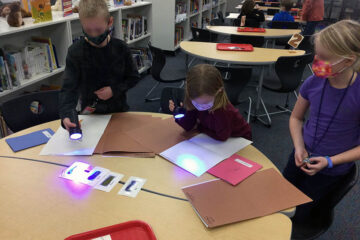
Challenge your students’ powers of deduction to determine which of four suspects committed several different burglaries. This module is low cost, easy to run, and versatile for a range of ages and durations.

Hestia | Developed by ThemeIsle